
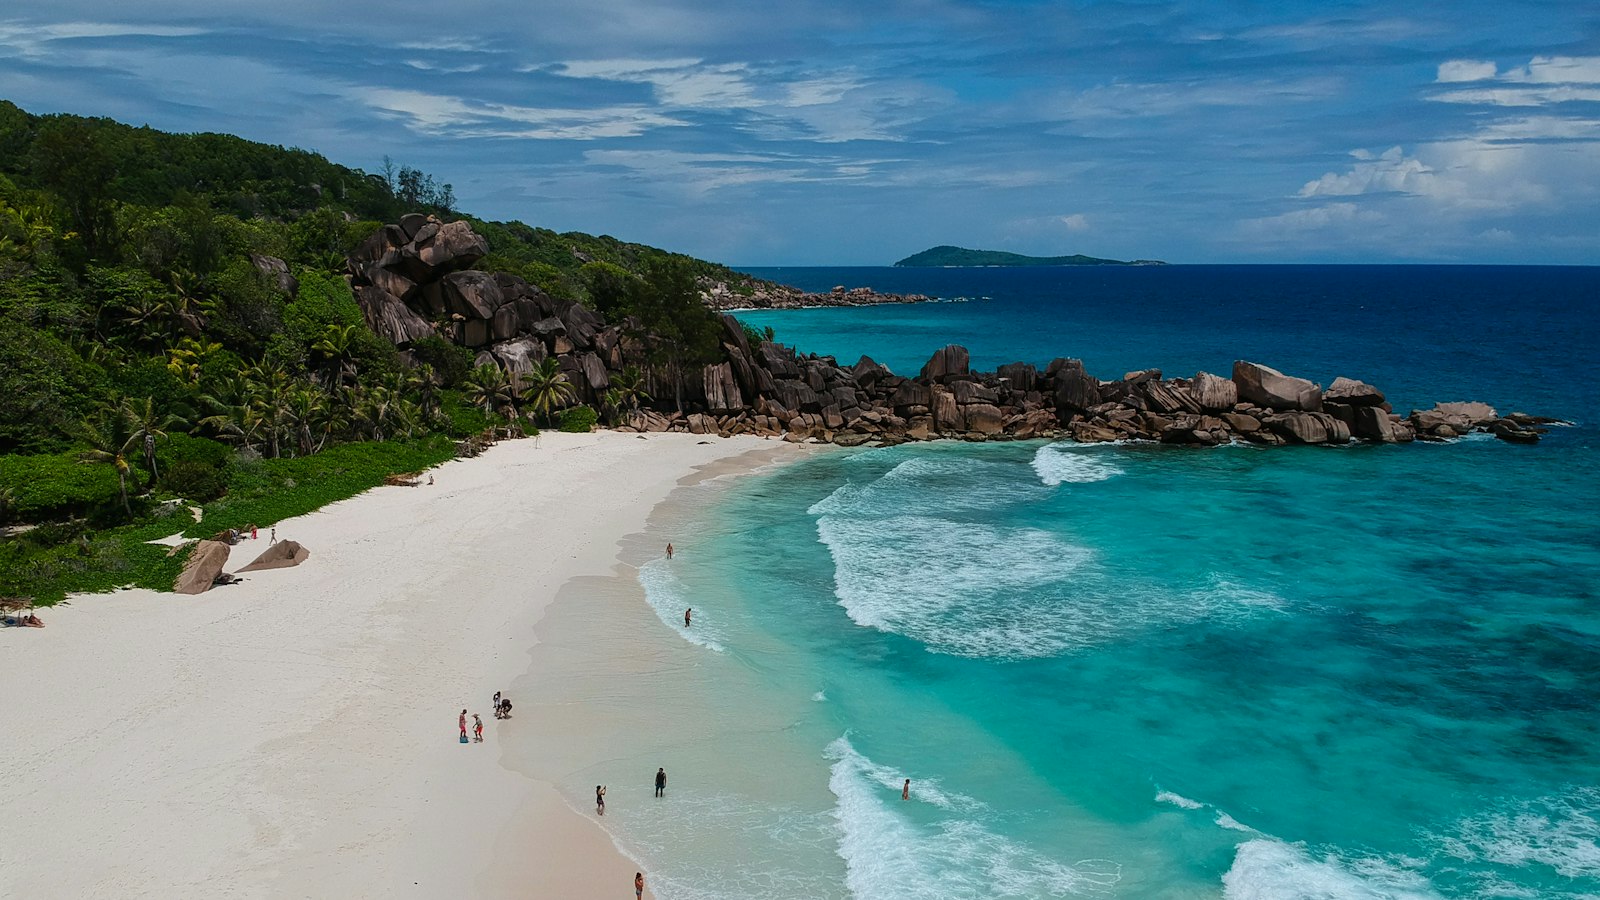
The Seychelles generated $19,157 of GDP per person in 2026. Burundi generated $510. That is a ratio of 38 inside a single continent. In its World Economic Outlook published on 13 October 2026, the IMF projects GDP per capita for 52 African countries. The ranking below orders them from richest to poorest, with purchasing power parity (PPP) alongside: that second column is where the geography of African wealth changes shape.
The two measures do not tell the same story. In current dollars, the Seychelles, Mauritius and Gabon take the podium. In purchasing power parity, Egypt (23 624 international dollars) moves ahead of Botswana, Algeria (19 719) ahead of South Africa, and Nigeria — 29th in current dollars — climbs back to Morocco’s level. The gap is not a technicality: it measures what a given income actually buys in the country where it is earned.
Ranking: GDP per capita in Africa in 2026
GDP per capita in current US dollars (the sorting column), in international dollars at PPP, population in millions, and change in nominal GDP per capita between 2025 and 2026. IMF projections, World Economic Outlook, October 2026.
The Afriques newsletter
- Free & no spam
- 1 email per day
- Unsubscribe in 1 click
| Rank | Country | GDP per capita 2026 (USD) | GDP per capita PPP (intl. $) | Population (M) | Change 2025→2026 |
|---|---|---|---|---|---|
| 1 | Seychelles | 19 157 | 37 183 | 0,1 | +0,8 % |
| 2 | Mauritius | 13 671 | 35 434 | 1,2 | +5,7 % |
| 3 | Gabon | 11 034 | 26 224 | 2,4 | +16,3 % |
| 4 | Botswana | 8 563 | 22 135 | 2,6 | +9,8 % |
| 5 | Equatorial Guinea | 8 484 | 18 880 | 1,7 | +8,1 % |
| 6 | South Africa | 7 659 | 16 841 | 63,9 | +13,1 % |
| 7 | Libya | 7 557 | 18 224 | 7,5 | +26,0 % |
| 8 | Algeria | 6 910 | 19 719 | 48,0 | +15,2 % |
| 9 | Cape Verde | 6 556 | 13 466 | 0,5 | +10,0 % |
| 10 | Namibia | 5 742 | 12 513 | 3,1 | +16,6 % |
| 11 | Morocco | 5 141 | 12 425 | 38,0 | +5,4 % |
| 12 | Tunisia | 5 053 | 16 022 | 12,4 | +9,0 % |
| 13 | Eswatini | 4 775 | 13 394 | 1,3 | +15,1 % |
| 14 | São Tomé and Príncipe | 4 582 | 6 501 | 0,2 | +12,2 % |
| 15 | Djibouti | 4 556 | 10 062 | 1,1 | +7,2 % |
| 16 | Egypt | 4 024 | 23 624 | 110,1 | +19,1 % |
| 17 | Angola | 3 876 | 10 713 | 40,6 | +8,0 % |
| 18 | Zimbabwe | 3 718 | 8 499 | 17,7 | +10,7 % |
| 19 | Ghana | 3 604 | 9 242 | 35,7 | +10,2 % |
| 20 | Côte d’Ivoire | 3 264 | 8 694 | 33,8 | +7,5 % |
| 21 | Mauritania | 3 015 | 9 227 | 4,7 | +10,7 % |
| 22 | Republic of the Congo | 2 867 | 6 820 | 6,7 | +20,5 % |
| 23 | Guinea | 2 797 | 8 011 | 16,2 | +4,6 % |
| 24 | Kenya | 2 785 | 8 036 | 54,3 | +9,3 % |
| 25 | Cameroon | 2 115 | 6 034 | 30,6 | +6,8 % |
| 26 | Zambia | 1 882 | 4 650 | 22,5 | +43,6 % |
| 27 | Comoros | 1 859 | 4 194 | 0,9 | +5,1 % |
| 28 | Benin | 1 799 | 5 181 | 15,2 | +8,3 % |
| 29 | Nigeria | 1 594 | 10 051 | 242,6 | +30,4 % |
| 30 | Togo | 1 480 | 4 275 | 8,9 | +7,9 % |
| 31 | Uganda | 1 453 | 4 158 | 49,7 | +5,0 % |
| 32 | Guinea-Bissau | 1 429 | 3 513 | 2,1 | +8,7 % |
| 33 | Mali | 1 343 | 3 684 | 26,0 | +8,5 % |
| 34 | Tanzania | 1 325 | 4 447 | 72,6 | +4,3 % |
| 35 | Burkina Faso | 1 316 | 3 241 | 24,6 | +14,5 % |
| 36 | Lesotho | 1 298 | 3 325 | 2,4 | +10,9 % |
| 37 | Chad | 1 295 | 3 433 | 19,5 | +11,8 % |
| 38 | Rwanda | 1 290 | 4 652 | 14,5 | +11,6 % |
| 39 | Ethiopia | 1 131 | 4 996 | 112,4 | −1,0 % |
| 40 | DR Congo | 1 111 | 2 138 | 110,0 | +27,5 % |
| 41 | Gambia | 1 030 | 3 887 | 2,9 | +5,8 % |
| 42 | Liberia | 976 | 2 113 | 5,9 | +7,3 % |
| 43 | Sierra Leone | 946 | 3 933 | 9,0 | +8,3 % |
| 44 | Central African Republic | 891 | 2 170 | 5,7 | +6,0 % |
| 45 | Somalia | 850 | 1 976 | 17,4 | +8,9 % |
| 46 | Niger | 774 | 2 211 | 30,2 | +5,9 % |
| 47 | Malawi | 740 | 1 819 | 24,8 | +17,9 % |
| 48 | Mozambique | 673 | 1 721 | 36,8 | +2,1 % |
| 49 | Madagascar | 649 | 2 124 | 32,3 | +4,8 % |
| 50 | South Sudan | 642 | 1 582 | 12,4 | +41,3 % |
| 51 | Sudan | 597 | 2 576 | 51,7 | −17,6 % |
| 52 | Burundi | 510 | 1 036 | 14,9 | +8,8 % |
Senegal and Eritrea are not listed: the IMF publishes no numerical projection for either country in the October 2026 edition. No value has been extrapolated.
The headline: a ratio of 38 between first and last
Between the Seychelles (19 157 dollars) and Burundi (510 dollars), the gap reaches 38 to one. The African median stands at 1 882 dollars per person: half of the countries ranked sit below that line, which the top four clear by a factor of five to ten. The continent does not hold one ladder of wealth but two economic worlds side by side.
It is not only a question of size. The top five — Seychelles, Mauritius, Gabon, Botswana, Equatorial Guinea — together generate about 82 billion dollars of GDP, or 2,3% of the combined GDP of the 52 countries ranked, for 8,0 million people: less than 0,5% of the population covered. High income per head is first a structural effect — a small population combined with high value added per worker (upscale tourism, offshore finance, minerals) or an oil rent.
The reverse is visible at the bottom. Burundi (510 dollars), Sudan (597 dollars, in civil war since 2023), South Sudan (642), Madagascar (649) and Mozambique (673) close the ranking. All five share a population growing faster than output; three rely overwhelmingly on low-productivity agriculture, and one has seen its productive capital destroyed by war.
Current dollars versus purchasing power parity: two rankings, two truths
On a PPP basis the podium holds — Seychelles 37 183, Mauritius 35 434, Gabon 26 224 international dollars — but the rest of the hierarchy reshuffles deeply. Egypt, 16th in current dollars at 4 024 dollars, reaches 23 624 international dollars: the fourth-highest level on the continent, ahead of Botswana. Tunisia moves ahead of Morocco, and South Africa falls behind Algeria.
Nigeria is the clearest case. At 1 594 dollars per person in current dollars (29th), it looks close to Djibouti; at 10 051 international dollars in PPP, it sits at Morocco’s level. The mechanism is simple: the official naira exchange rate has more than halved since 2023, which crushes dollar-denominated income per capita without destroying domestic output. Income earned in naira still buys local goods and services whose prices did not follow the devaluation.
Zimbabwe shows the mirror image: 23rd in current dollars (3 718 dollars), it drops back into the pack at PPP (8 499 international dollars). Its nominal GDP per capita jumped +10,7 % in a year — not through enrichment, but through a largely dollarised economy and an inflation history that long distorted conversions.
The biggest 2026 gains are not the richest countries
Measured by year-on-year change in current dollars, the leaders are low-income starting points: Zambia (+43,6 %), South Sudan (+41,3 %), Nigeria (+30,4 %), DR Congo (+27,5 %) and Libya (+26,0 %). For several of them the rise reflects no enrichment at all: a past depreciation stabilising, a rebound after collapse, or inflation — 14,1% in Libya — inflating nominal figures.
The right gauge of a living-standard gain remains output per head adjusted for inflation. On that basis Equatorial Guinea, whose GDP per capita rises +8,1 % in current dollars with real growth of −1,7 % and inflation held to 3,3%, keeps most of its gain, while Libya’s is absorbed. At the other end, Ethiopia falls −1,0 % in current dollars despite real growth of +9,2 %: inflation at 11,7% and a birr devaluation wipe out the advance in volume.
One obvious point no table shows: between 510 and 19 157 dollars, all 52 countries ranked remain, on a world scale, in the lower half of incomes. The richest African country per capita would sit barely at the global average. Africa’s fracture is real; it reads first inside the continent.
How to read this ranking without getting it wrong
- A level ranking, not a momentum ranking. To see which countries are growing fastest, read our 2026 economic growth ranking: Ethiopia and Rwanda lead there while sitting near the bottom here.
- An average, not a social median. GDP per capita says nothing about distribution: South Africa, 6th in the ranking, remains one of the most unequal countries in the world, and Equatorial Guinea (8 484 dollars per person) has a human development index far below its economic rank.
- PPP compares living costs, not wealth. An international dollar is not an accounting dollar. Cross-read it with our cost of living in Africa 2026 ranking to see what an income actually buys.
- A projection, not a statement of fact. The October 2026 IMF edition is a forecast; revisions between editions can reach several percentage points.
Frequently asked questions
Which African country has the highest GDP per capita in 2026?
The Seychelles, at 19 157 dollars per person in current dollars and 37 183 international dollars at purchasing power parity, according to IMF projections published in October 2026. A population of about 120,000 and upscale tourism explain that level. Mauritius (13 671 dollars) and Gabon (11 034 dollars) complete the podium.
Why does Egypt rank so much higher on purchasing power parity?
Because the official exchange rate of the Egyptian pound has been sharply devalued since 2022. GDP per capita in current dollars (4 024 dollars) is therefore compressed, while domestic output — and thus what an income buys locally — falls far less. On a PPP basis Egypt reaches 23 624 international dollars, the fourth-highest level in Africa.
Which African country is the poorest per capita in 2026?
Burundi, at about 510 dollars per person, followed by Sudan (597 dollars), South Sudan (642 dollars) and Madagascar (649 dollars). These economies combine rapid population growth with a narrow productive base and, in Sudan’s case, an armed conflict that has destroyed much of the productive capital.
Is GDP per capita enough to measure living standards?
No. It measures an average, not a distribution: a country can post high GDP per capita while most of its people remain poor. It ignores the informal economy, often the majority in Africa, and real access to public services. It should be read alongside life expectancy, schooling and the human development index.
Why are Senegal and Eritrea missing from the ranking?
Because the IMF publishes no numerical GDP per capita projection for either country in the October 2026 edition of its World Economic Outlook. We chose to exclude them rather than extrapolate from an earlier edition, which would have produced an unsourced rank.
Which country progressed the most in 2026?
In current dollars, Zambia (+43,6 %) and South Sudan (+41,3 %) lead, ahead of Nigeria (+30,4 %). But those increases mostly reflect exchange-rate effects and rebounds after collapse, not an equivalent gain in wealth. Adjusted for inflation, several of them shrink sharply.
Can these figures be revised?
Yes. These are projections, and the IMF revises its series with each half-yearly edition. Countries with little economic diversification, dependent on a single commodity price or an administered exchange rate, are the most exposed. The figures should be read as a dated order of magnitude, not a definitive measurement.
Methodology & sources
What the sorting column measures. GDP per capita in current dollars is nominal GDP (series NGDPD) divided by total population (series LP), both from the IMF World Economic Outlook published on 13 October 2026. It is the conventional measure, but it is sensitive to exchange rates: a currency depreciation lowers dollar GDP per capita without reducing real output.
What purchasing power parity measures. GDP per capita at PPP (series PPPPC) converts output into international dollars at a rate that equalises purchasing power across countries. It neutralises exchange-rate effects and compares real living standards better, but says nothing about the cost of imported goods or domestic distribution.
The annual change. It compares nominal GDP per capita in 2026 with 2025 within the same IMF edition. It therefore blends three effects — real growth, inflation and currency moves — and must not be read as a change in purchasing power.
Coverage. 52 African countries with a numerical projection for 2026. Western Sahara, which the IMF does not cover, is excluded. Senegal and Eritrea are excluded for lack of a published projection and flagged as such under the table.
Sources. IMF, World Economic Outlook, October 2026, queried through the IMF DataMapper for series NGDPDPC (nominal GDP per capita), PPPPC (purchasing power parity), NGDPD (nominal GDP), NGDP_RPCH (real growth), PCPIPCH (inflation) and LP (population). Regional framework: Regional Economic Outlook sub-Saharan Africa, October 2026. Development levels: UNDP, Human Development Report.
Assumed limits. GDP per capita ignores the informal economy, income distribution and cost-of-living differences within a country. Projections are forecasts, not outcomes. Finally, the conversion into current dollars relies on an exchange rate that, for several countries listed, diverges sharply from the parallel-market rate.
Spotted an error or a figure that needs updating? Write to [email protected].
Last updated: 4 November 2026. Data: IMF WEO October 2026.
The information in this article is indicative only and does not constitute investment, financial, tax or legal advice. Consult a professional before any decision.